
01 What is Eastrail?
"Eastrail, a beloved trail destination in Seattle's Eastside suburbs, embodies both rich historical significance and vibrant contemporary usage."


The Eastrail system currently faces significant challenges impacting user experience, safety, and community engagement.
Key issues include
(1) A gap in real-time information updates,
(2) Safety risks due to high-speed traffic,
(3) Underutilization of the trail's natural and historical attributes.

Background
What is going on out there?
Eastrail is a new, long city trail. The trail managers do not know how many people are there or what they are doing. Meanwhile, the users also want to learn more about the trail.
Goal
Help managers monitor trail usage, while enhance user engagement.
Assist managers in monitoring user activity and quantity on the trail by collecting data on user numbers and behaviors.
Potential Impact
It's useful and fun! Love it!
Enhance the management efficiency of the Eastrial management team by providing real-time insights into user status. Offer users a 'lighthouse' experience on the trail.
Duration
Sep 2023 - Mar 2024
6 monts
Type
Launch Project
UX / UI
Product
My Roles
UX/UI design
Product Design
3D Modeling
AR Design
User Research
Tools
Figma
Sketch
Adobe Creative Suite
Niantic 8th Wall
02 Final Design Overview
Highlight 1
Dashboard System for Trail Managers


Highlight 2
Web App System for Trail Users


Highlight 3
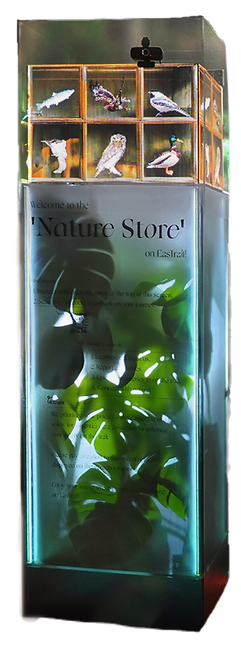
"Lighthouse" Installation on the Trail


Augmented Reality Nature Review
Interactive Local Fauna Display
Speed Tracking Alert
Demo Video
Design Question
How might we leverage modern technology effectively gather and visualize real-time data on Eastrail's usage and trail user feedback, in a way that seamlessly integrates with the trail's environment and aligns with users' expectations of privacy and experience?
03 Design Process
We identified key challenges through user and stakeholder data analysis and interviews. Following UX/UI design principles, We refined solutions through research, ideation, usability testing, iterative development, and teamwork, enhancing the EasTrail experience.

The Whole Process Flow


Design Iteration 1


/ Senario 1. Enjoy Leisure Time
/ Senario 2. Report Issues
/ Senario 3. Learn about the Creatures


Scope
Persona
Our user base is divided into 3 categories, with the primary group being general Eastrail users. Primary research has revealed that their needs are highly focused.


Design Iteration 2

Drawing
with Water

Rain
Storage

Speed
Notice

Web App
Introduction
A brush is provided to draw the natural scenery. Frosted acrylic is utilized to allow the drawings to dry automatically with the wind.
A dedicated rooftop is designed to store rainwater for drawing purposes, utilizing the rainy weather in the Seattle and promoting environmental friendliness.
An LED light strip that flashes the word "Speed" to alert users of their current pace,
Deploy data collection devices along the trail and visualize data in Web App.

Installation


Jatson
Nano
Power
Station
Neon
Light Strip
Webcam
Thermal
Printer

Web App
Wire Frame

For Trail Users


Take a Receipt
Users can get a printed receipt after drwaing on the installation, take the experience home with useful information and coupons.
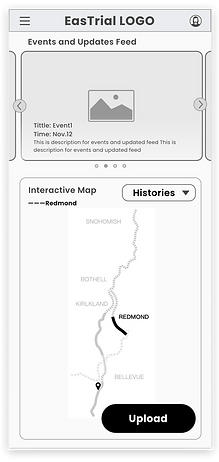
Interactive Map
The interactive map in the web app provides users with rich information, promoting user engagement and community participation.
Get More Info
Users can get most of the information needed on this interactive map, including hisotry, amenties, events, issues, highlight spots, special creatures etc.
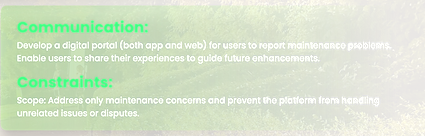
Report Problem
The users can report any issues they find on the trail and send them directly to the management team, ensuring fast communication.
Responsive Design on PC
The web app can be accessed on computers, allowing users to access more information from home. The charts of real-time user numbers and activity on the trail are incorporated, providing users with better insights on when and where to go. They can also click to see the detail on map.
For Trail Managers

Real-Time User Number Dashboard
Members of the trail management team can access statistical data on the number of users using each segment of the trail and the activities they are engaged in. Data captured by cameras along the trail is visualized in a user-friendly manner using algorithms.


Feedback Management
The issues reported to the trail users are sent directly to the managers' email address, while they can see the statistics of reported issues on this dashborad. It helps the management team to see the degree of urgency of different issues and take actions faster.


DESIGN
Usability Test
We have communicated the draft ideas, rendering pictures and App wireframe with key stakeholders including our sponsor from Meta, organizers of Eastrail, and our advisors in GIX. They all liked our project proposal and approved it. The next step is to test the idea with the last key stakeholder group, the trail users.
Our three main goals are:
1) Test the overall usability,
2) Make decisions on the undecided features,
3) Ask for users’ subjective opinions and look for potential improvement.


Final Design


